Simply put, the cost of living is the amount of money necessary to cover an individual’s basic expenses in a particular location at a given time period. This includes housing, food, transportation, healthcare, and miscellaneous expenses.
Planning to relocate to Hillsborough, CA, and wondering if it’s affordable? It is essential to know the cost of living in this town, since affordability can really shape your decisions.
In this article, we provide vital information on Hillsborough, CA, cost of living to help you assess if your plans of moving would be beneficial for you and your family given your projected income.

Hillsborough's Cost of Living: An Overall Snapshot
| Index | Hillsborough | California | National |
|---|---|---|---|
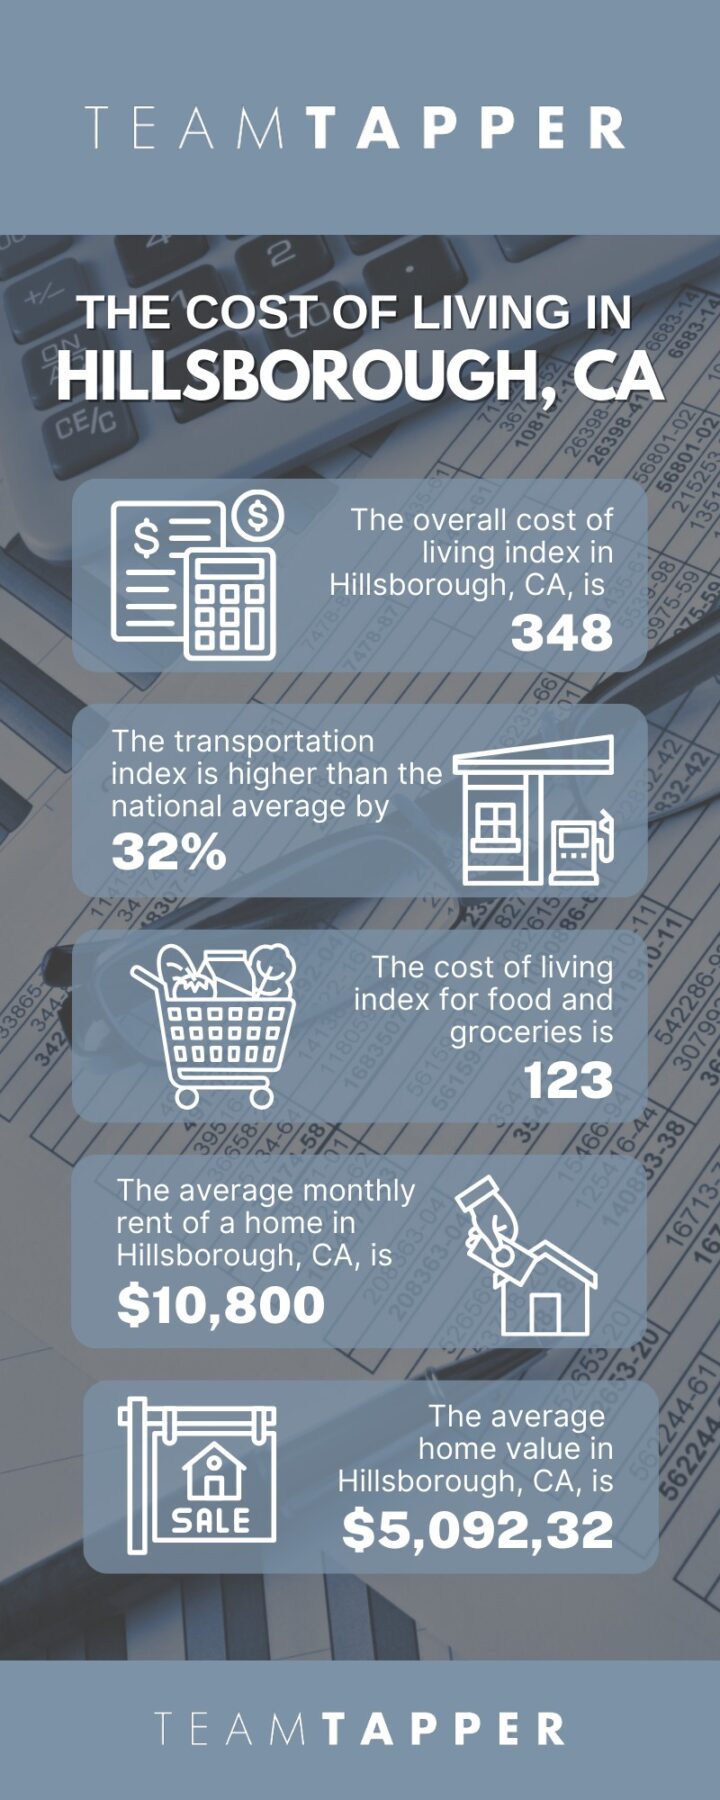
| Overall | 348 | 140 | 100 |
| Goods & services | 120 | 111 | 100 |
| Groceries | 123 | 112 | 100 |
| Health care | 125 | 109 | 100 |
| Housing | 869 | 196 | 100 |
| Transportation | 132 | 126 | 100 |
| Utilities | 136 | 127 | 100 |
The cost-of-living index is based on a national average of 100. Given this, based on the table above, the overall cost of living in Hillsborough is 248% higher than the national average.
The breakdown for each index is as follows:
- Goods & services: 33%
- Groceries:13%
- Health care: 5%
- Housing: 30%
- Transportation: 9%
- Utilities: 10%
If affordability is among your top priorities when searching for a new place to live, Hillsborough may not be an ideal fit, as the cost of living in this town is among the most expensive in the country.

Housing Costs in Hillsborough, CA
Housing expenses, such as home and rent prices, mortgage rates, and insurance, are a very significant part of the Hillsborough cost of living index – 769% higher than the national average.
As of July 2025, home prices range from $3 million to $17.8 million. The average home value in the Hillsborough housing market is $5,092,326.
The Hillsborough CA median home list price is $6,097,500, while the median home sold price is $5.1 million.
The monthly rent for homes in Hillsborough, CA, ranges between $1,990 and $24,000. The average rent in the area is $10,800, 414.29% higher than the national average of $2,100.
The affordability of homes in Hillsborough, CA, can be predicted by what percentage of one’s monthly income is spent on housing related costs.
The overall rule of thumb is that the overall costs related to housing should not amount to more than 28% of your gross income.
Among Hillsborough homeowners, the median income is $250,001. Given this, the maximum amount homeowners can spend on all housing related costs is $5,833.
For renters, the median income is $181,339, and the maximum amount they can spend on their rent-related monthly costs is $4,231.
Other Major Living Expenses
Utility Costs
In Hillsborough, CA, utility costs are 36% more expensive compared to the national average. Factors like the size of the home, energy efficiency, and usage habits influence the actual monthly utility costs.
| Item | Hillsborough | National Average | Difference |
|---|---|---|---|
| All Electricity | $298.77 | $193.99 | 54.0% higher |
| Phone | $203.63 | $192.25 | 5.9% higher |

Groceries and Food Prices
Grocery prices have substantially increased in the past few years. In Hillsborough, the grocery index is 23% higher than the national average.
| Item | Hillsborough | National Average | Difference |
|---|---|---|---|
| Ground Beef | $6.23 | $5.84 | 6.7% higher |
| Fried Chicken | $2.11 | $1.57 | 34.1% higher |
| Milk | $5.18 | $4.67 | 10.9% higher |
| Potatoes | $4.98 | $4.93 | 0.9% higher |
| Pizza | $15.74 | $12.09 | 30.2% higher |
| Beer | $11.21 | $10.41 | 7.6% higher |
Transportation Costs
For vehicle owners, monthly transportation expenses encompass fuel, insurance, routine maintenance, and lease or financing payments. In Hillsborough, the transportation index is 32% higher than the national average.
| Item | Hillsborough | National Average | Difference |
|---|---|---|---|
| Gasoline | $4.63 | $3.46 | 33.9% higher |
| Tire Balancing | $75.33 | $59.92 | 25.7% higher |

Healthcare Costs
The average cost of healthcare in Hillsborough is 25% higher than the national average.
| Item | Hillsborough | National Average | Difference |
|---|---|---|---|
| Optometrist | $159.79 | $125.68 | 27.1% higher |
| Doctor | $174.45 | $135.78 | 28.5% higher |
| Dentist | $155.36 | $113.29 | 37.1% higher |
| Ibuprofen | $11.30 | $10.65 | 6.1% higher |
| Lipitor | $498.84 | $468.60 | 6.5% higher |
Salary Needed to Live Comfortably in Hillsborough, CA
To live comfortably in Hillsborough, CA, an annual income of at least $945,000 is recommended for a family, and $120,000 for a single person.
On a monthly basis, this translates to an income of $78,750 for a family, which is 1,358.3% more expensive than the national average. The recommended monthly income for an individual person of $10,000 is 109.8% more expensive than the national average.
Conclusion
Hillsborough, CA, may come with a significantly high cost of living, particularly for housing, but it is highly desired for its beautiful upscale neighborhoods, sense of privacy and safety, excellent schools, and convenient access to amenities.
If you’d like to explore your home options in Hillsborough, CA, please give us a call today at (650) 629-9898 or send us an email at teamtapper@gmail.com to schedule an appointment.
Frequently Asked Questions
Yes, Hillsborough, CA, is an expensive place to live. The overall cost of living in this town is 248% higher than the national average.
The monthly rent for houses in Hillsborough, CA, ranges between $1,990 and $24,000. The average rent in the area is $10,800, which is 414.29% higher than the national average of $2,100
To live comfortably in Hillsborough, CA, an annual income of at least $945,000 ($78,750 per month) is recommended for a family, and $120,000 ($10,000 per month) for a single person.
The median home list price in Hillsborough, CA, is $6,097,500, while the median home sold price is $5.1 million.
Yes, they are relatively expensive. The cost of utilities is 36% more expensive compared to the national average, and groceries are 20% higher than the national average.